
- Home
- SEODiscover the latest updates from across the United States, including politics, culture, economy, and trending stories. Stay informed on the key events shaping the nation and the topics everyone’s talking about.
- Technical SEOLearn technical SEO concepts including crawling, indexing, XML sitemaps, robots.txt, canonical tags, site architecture, and website performance.
- Local SEOOptimize your business for local seo with Google Business Profile, local citations, reviews, maps, and location-based SEO.
- Mobile SEOImprove your website’s mobile seo performance with responsive design, mobile-first indexing, usability, and page speed optimization.
- On-Page SEOExplore on-page seo optimization techniques such as title tags, meta descriptions, headings, URLs, internal linking, and content optimization.
- Off-Page SEODiscover off-page SEO strategies such as backlinks, digital PR, brand mentions, outreach, and authority building.
- SEO ToolsExplore the best SEO tools for keyword research, technical audits, backlink analysis, rank tracking, and website optimization.
- Core Web VitalsLearn how to improve Core Web Vitals including LCP, INP, CLS, page speed, and overall user experience for better rankings.
- Keyword ResearchLearn how to find profitable keywords, analyze search intent, evaluate competition, and build effective keyword strategies.
- Link BuildingMaster ethical link building techniques, backlink analysis, outreach methods, guest posting, and authority growth strategies.
- Google Search ConsoleLearn how to use Google Search Console to monitor indexing, fix errors, analyze search performance, and improve SEO.
- SEO BasicsLearn the fundamentals of search engine optimization (SEO Basics), including how search engines work, SEO terminology, and beginner-friendly best practices.
- Paid Media
- Display AdvertisingLearn display advertising strategies, banner ads, audience targeting, remarketing, Google Display campaigns, and optimization techniques.
- Google AdsLearn Google Ads strategies, campaign setup, bidding, keywords, Performance Max, Search Ads, and optimization techniques.
- LinkedIn AdsLearn LinkedIn Ads strategies for B2B marketing, lead generation, audience targeting, campaign optimization, and paid social advertising.
- Meta AdsLearn Meta Ads strategies for Facebook and Instagram, including campaign setup, targeting, retargeting, and performance optimization.
- Paid Media AnalyticsLearn paid media analytics, including CPC, CTR, CPA, ROAS, conversion tracking, attribution, reporting, and campaign performance analysis.
- PPC StrategyLearn effective PPC strategies, campaign planning, bidding, keyword targeting, landing pages, conversion optimization, and more.
- ContentTransform your living spaces with inspiration, tips, and trends in interior design. From minimalist decor to bold statements, find ideas for every style and budget.
- Social
- Digital MarketingExplore stories and advice on living your best life. From personal growth to entertainment, dive into the latest in lifestyle trends and inspiration.
- Artificial IntelligenceStay informed about health and wellness with expert advice, fitness tips, and the latest medical breakthroughs. Your guide to a healthier and happier life.
- DevelopmentYou will find development related educational articles
- GTMLearn Google Tag Manager (GTM) with practical guides for tags, triggers, variables, tracking, conversions, and website analytics implementation.
- HTMLLearn HTML with simple tutorials, examples, tags, elements, attributes, and best practices for building modern web pages.
- HTML CSSLearn HTML CSS together with practical tutorials, examples, layouts, styling techniques, responsive design, and modern web development practices.
- HTML JSLearn HTML JS – JavaScript with practical tutorials and examples for adding interactivity, dynamic content, events, and functionality to web pages.
- JavaScriptExplore JavaScript tutorials, examples, concepts, and practical techniques for creating interactive and dynamic websites and web applications.
- PHPLearn PHP programming with practical tutorials, examples, functions, syntax, and web development techniques for beginners and developers.
- PythonLearn Python programming with practical tutorials, examples, syntax, functions, automation techniques, and useful programming concepts.
- Home
- SEODiscover the latest updates from across the United States, including politics, culture, economy, and trending stories. Stay informed on the key events shaping the nation and the topics everyone’s talking about.
- Technical SEOLearn technical SEO concepts including crawling, indexing, XML sitemaps, robots.txt, canonical tags, site architecture, and website performance.
- Local SEOOptimize your business for local seo with Google Business Profile, local citations, reviews, maps, and location-based SEO.
- Mobile SEOImprove your website’s mobile seo performance with responsive design, mobile-first indexing, usability, and page speed optimization.
- On-Page SEOExplore on-page seo optimization techniques such as title tags, meta descriptions, headings, URLs, internal linking, and content optimization.
- Off-Page SEODiscover off-page SEO strategies such as backlinks, digital PR, brand mentions, outreach, and authority building.
- SEO ToolsExplore the best SEO tools for keyword research, technical audits, backlink analysis, rank tracking, and website optimization.
- Core Web VitalsLearn how to improve Core Web Vitals including LCP, INP, CLS, page speed, and overall user experience for better rankings.
- Keyword ResearchLearn how to find profitable keywords, analyze search intent, evaluate competition, and build effective keyword strategies.
- Link BuildingMaster ethical link building techniques, backlink analysis, outreach methods, guest posting, and authority growth strategies.
- Google Search ConsoleLearn how to use Google Search Console to monitor indexing, fix errors, analyze search performance, and improve SEO.
- SEO BasicsLearn the fundamentals of search engine optimization (SEO Basics), including how search engines work, SEO terminology, and beginner-friendly best practices.
- Paid Media
- Display AdvertisingLearn display advertising strategies, banner ads, audience targeting, remarketing, Google Display campaigns, and optimization techniques.
- Google AdsLearn Google Ads strategies, campaign setup, bidding, keywords, Performance Max, Search Ads, and optimization techniques.
- LinkedIn AdsLearn LinkedIn Ads strategies for B2B marketing, lead generation, audience targeting, campaign optimization, and paid social advertising.
- Meta AdsLearn Meta Ads strategies for Facebook and Instagram, including campaign setup, targeting, retargeting, and performance optimization.
- Paid Media AnalyticsLearn paid media analytics, including CPC, CTR, CPA, ROAS, conversion tracking, attribution, reporting, and campaign performance analysis.
- PPC StrategyLearn effective PPC strategies, campaign planning, bidding, keyword targeting, landing pages, conversion optimization, and more.
- ContentTransform your living spaces with inspiration, tips, and trends in interior design. From minimalist decor to bold statements, find ideas for every style and budget.
- Social
- Digital MarketingExplore stories and advice on living your best life. From personal growth to entertainment, dive into the latest in lifestyle trends and inspiration.
- Artificial IntelligenceStay informed about health and wellness with expert advice, fitness tips, and the latest medical breakthroughs. Your guide to a healthier and happier life.
- DevelopmentYou will find development related educational articles
- GTMLearn Google Tag Manager (GTM) with practical guides for tags, triggers, variables, tracking, conversions, and website analytics implementation.
- HTMLLearn HTML with simple tutorials, examples, tags, elements, attributes, and best practices for building modern web pages.
- HTML CSSLearn HTML CSS together with practical tutorials, examples, layouts, styling techniques, responsive design, and modern web development practices.
- HTML JSLearn HTML JS – JavaScript with practical tutorials and examples for adding interactivity, dynamic content, events, and functionality to web pages.
- JavaScriptExplore JavaScript tutorials, examples, concepts, and practical techniques for creating interactive and dynamic websites and web applications.
- PHPLearn PHP programming with practical tutorials, examples, functions, syntax, and web development techniques for beginners and developers.
- PythonLearn Python programming with practical tutorials, examples, syntax, functions, automation techniques, and useful programming concepts.
Now Reading: What Is Time to First Byte (TTFB)? Causes, Testing, and Optimization Guide
-
01
What Is Time to First Byte (TTFB)? Causes, Testing, and Optimization Guide
- Home//
- SEO//Discover the latest updates from across the United States, including politics, culture, economy, and trending stories. Stay informed on the key events shaping the nation and the topics everyone’s talking about.
- Technical SEO//Learn technical SEO concepts including crawling, indexing, XML sitemaps, robots.txt, canonical tags, site architecture, and website performance.
- Local SEO//Optimize your business for local seo with Google Business Profile, local citations, reviews, maps, and location-based SEO.
- Mobile SEO//Improve your website’s mobile seo performance with responsive design, mobile-first indexing, usability, and page speed optimization.
- On-Page SEO//Explore on-page seo optimization techniques such as title tags, meta descriptions, headings, URLs, internal linking, and content optimization.
- Off-Page SEO//Discover off-page SEO strategies such as backlinks, digital PR, brand mentions, outreach, and authority building.
- SEO Tools//Explore the best SEO tools for keyword research, technical audits, backlink analysis, rank tracking, and website optimization.
- Core Web Vitals//Learn how to improve Core Web Vitals including LCP, INP, CLS, page speed, and overall user experience for better rankings.
- Keyword Research//Learn how to find profitable keywords, analyze search intent, evaluate competition, and build effective keyword strategies.
- Link Building//Master ethical link building techniques, backlink analysis, outreach methods, guest posting, and authority growth strategies.
- Google Search Console//Learn how to use Google Search Console to monitor indexing, fix errors, analyze search performance, and improve SEO.
- SEO Basics//Learn the fundamentals of search engine optimization (SEO Basics), including how search engines work, SEO terminology, and beginner-friendly best practices.
- Paid Media//
- Display Advertising//Learn display advertising strategies, banner ads, audience targeting, remarketing, Google Display campaigns, and optimization techniques.
- Google Ads//Learn Google Ads strategies, campaign setup, bidding, keywords, Performance Max, Search Ads, and optimization techniques.
- LinkedIn Ads//Learn LinkedIn Ads strategies for B2B marketing, lead generation, audience targeting, campaign optimization, and paid social advertising.
- Meta Ads//Learn Meta Ads strategies for Facebook and Instagram, including campaign setup, targeting, retargeting, and performance optimization.
- Paid Media Analytics//Learn paid media analytics, including CPC, CTR, CPA, ROAS, conversion tracking, attribution, reporting, and campaign performance analysis.
- PPC Strategy//Learn effective PPC strategies, campaign planning, bidding, keyword targeting, landing pages, conversion optimization, and more.
- Content//Transform your living spaces with inspiration, tips, and trends in interior design. From minimalist decor to bold statements, find ideas for every style and budget.
- Social//
- Digital Marketing//Explore stories and advice on living your best life. From personal growth to entertainment, dive into the latest in lifestyle trends and inspiration.
- Artificial Intelligence//Stay informed about health and wellness with expert advice, fitness tips, and the latest medical breakthroughs. Your guide to a healthier and happier life.
- Development//You will find development related educational articles
- GTM//Learn Google Tag Manager (GTM) with practical guides for tags, triggers, variables, tracking, conversions, and website analytics implementation.
- HTML//Learn HTML with simple tutorials, examples, tags, elements, attributes, and best practices for building modern web pages.
- HTML CSS//Learn HTML CSS together with practical tutorials, examples, layouts, styling techniques, responsive design, and modern web development practices.
- HTML JS//Learn HTML JS – JavaScript with practical tutorials and examples for adding interactivity, dynamic content, events, and functionality to web pages.
- JavaScript//Explore JavaScript tutorials, examples, concepts, and practical techniques for creating interactive and dynamic websites and web applications.
- PHP//Learn PHP programming with practical tutorials, examples, functions, syntax, and web development techniques for beginners and developers.
- Python//Learn Python programming with practical tutorials, examples, syntax, functions, automation techniques, and useful programming concepts.
- Home
- Digital Marketing
- What Is Time to First Byte (TTFB)? Causes, Testing, and Optimization Guide
What Is Time to First Byte (TTFB)? Causes, Testing, and Optimization Guide

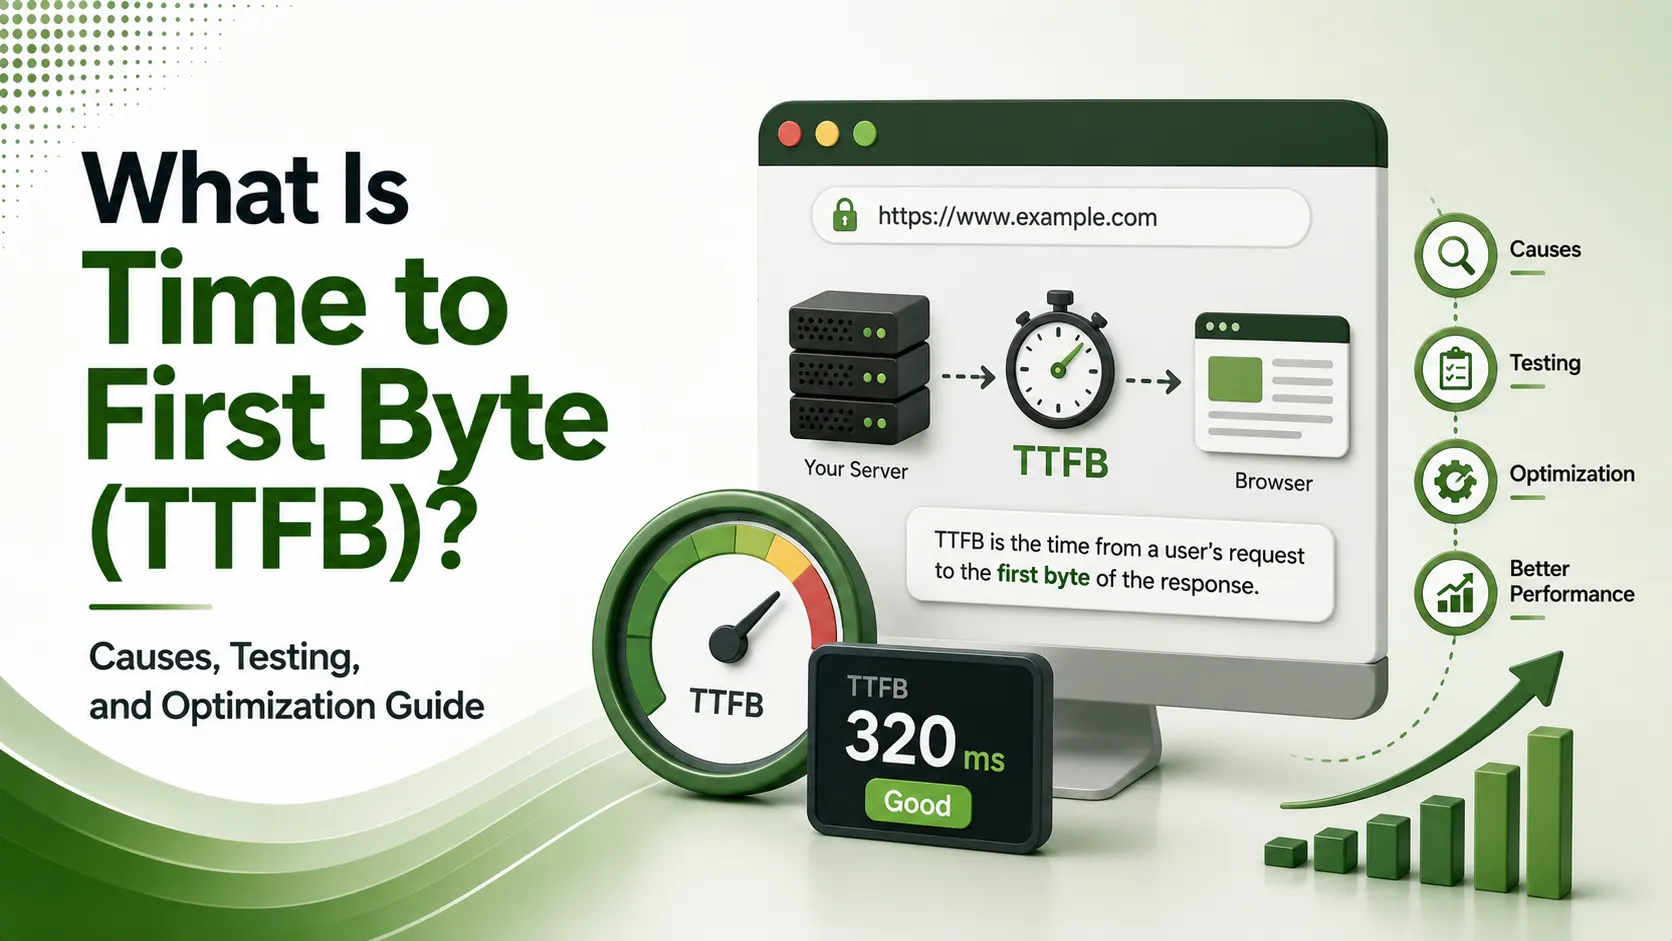
A slow TTFB caps every metric downstream of it LCP, FCP, all of it. Here's what causes it, how to test and decompose it into DNS/TLS/server phases, and a calculator to diagnose your own bottleneck.
Table of Contents
ToggleTTFB sets a ceiling that no front-end optimization can raise. You can compress every image, minify every script, and inline every critical style, and a page with a slow first-byte time will still feel sluggish, because nothing downstream can start until that first byte actually arrives. Here is what this metric measures, what actually causes it, how to test it, and how to fix it.
Time to First Byte, or TTFB, measures the elapsed time from when a browser sends a request to a server to the moment it receives the very first byte of that server's response.
This metric is not one of Google's three official Core Web Vitals, but it is tracked in the Chrome User Experience Report and directly feeds every loading metric that comes after it.
We covered the metrics TTFB directly influences in our guides to LCP and FCP. Neither of those metrics can improve past what TTFB allows, no matter how well-optimized the rest of the page is.
is Google's recommended "good" TTFB threshold at the 75th percentile of users
of downstream metrics, including LCP and FCP, are delayed by every millisecond of TTFB
distinct phases stack together to produce a single TTFB measurement
The Four Phases That Make Up TTFB
TTFB is not one single delay. It is several sequential phases stacked together, and diagnosing it correctly means identifying which phase is actually the bottleneck.
TTFB Thresholds: Good, Needs Improvement, and Poor
According to web.dev's official TTFB documentation, a good first-byte time is 0.8 seconds or less, and a poor one is anything greater than 1.8 seconds.
0-0.8s
0.8-1.8s
1.8s+
Video: "What is Time to First Byte (TTFB) - The Concepts of Web Performance" featuring Todd Gardner, Request Metrics — credit to the original creator, via YouTube
The Four Most Common Causes of Slow TTFB
According to PageSpeed Matters' 2026 TTFB guide, four causes explain the overwhelming majority of slow first-byte cases seen in real audits.
| Cause | What's Actually Happening |
|---|---|
| Slow database queries | Unindexed tables, N+1 queries, missing query caching |
| No server-side caching | Every request triggers full application processing instead of serving cached HTML |
| Poor hosting | Shared hosting with limited CPU/RAM, oversold servers, slow disk I/O |
| No CDN | Every request travels to the origin server regardless of visitor location |
Why Server Processing Time Usually Dominates the Total
Of the four phases, server processing is typically the largest and most variable component, since it depends entirely on how efficiently your backend application handles a request.
A static HTML file served directly from a CDN edge node might respond in under 50 milliseconds.
A dynamic page that queries a database, checks a session, and renders a template on every single request can easily take 500 milliseconds or more, even on reasonably capable hosting.
This variability is exactly why two sites on similar hosting plans can show dramatically different results. The difference rarely comes down to the server hardware itself. It usually comes down to how much unnecessary work the application does before it can generate a response.
How Caching Changes the Equation Entirely
Server-side caching sidesteps the processing bottleneck rather than trying to make the underlying work faster. Once a page is cached, a repeat request can be served directly from memory or disk, skipping the database queries and template rendering that made the first request slow.
This is why implementing even a basic full-page cache is often the single highest-leverage fix available.
It does not require touching application code or upgrading hosting, and it can turn a half-second delay into a response measured in milliseconds for the vast majority of visitors hitting already-cached pages.
The tradeoff is that caching works best for content that does not change on every request.
Highly personalized pages, real-time dashboards, or checkout flows built around live inventory data need more careful caching strategies, such as caching shared page fragments while leaving the personalized parts dynamic.
Lab TTFB vs. Field TTFB: Which One Should You Trust?
These two measurement types tell different stories about the same metric. Tap through both to see how they differ.
According to PageSpeed Matters' guide referenced above, field data from CrUX is what determines Google's ranking-related evaluation. Lab data is strictly for debugging and iteration, not the number Google actually uses.
Lab tools like WebPageTest and Lighthouse test TTFB under controlled conditions and can decompose the number into DNS, TCP, TLS, and server processing phases, making them the right tool for diagnosing exactly where a slow response actually comes from.
TTFB Diagnostic Calculator
Enter your TTFB breakdown from Chrome DevTools or WebPageTest to see which phase is your biggest bottleneck.
TTFB Diagnostic Calculator
Find these values in Chrome DevTools' Network tab under the Timing panel
Enter your numbers above and click diagnose.
Third-Party Scripts and Their Hidden Server-Side Cost
Most conversations about third-party scripts focus on their front-end weight, the extra JavaScript a browser has to download and execute. There is a less visible cost too, one that happens entirely on the server side before a response is even sent.
Some server-side integrations, like fraud detection checks, geolocation lookups, or personalization engines, make outbound API calls during the request cycle itself.
If any of those external services responds slowly, that delay gets absorbed directly into your own response time, even though the slowdown technically originated somewhere else entirely.
Auditing which server-side integrations are synchronous, meaning the response waits on them, versus asynchronous, meaning they run in the background without blocking the response, often reveals easy wins.
Moving non-critical checks to run after the initial response is sent can meaningfully shrink processing time without removing any functionality at all.
Setting Realistic Improvement Targets
Not every site needs to chase the absolute lowest possible number. A content-heavy publisher running dynamic ad auctions on every page load faces a different reality than a static marketing site with minimal backend logic.
A reasonable approach sets an initial target of moving from whatever band a site currently sits in toward the next one up, rather than aiming directly for a sub-200-millisecond result on the first attempt.
Incremental, measured improvement, verified with before-and-after testing, tends to produce more sustainable results than a single aggressive infrastructure overhaul attempted all at once.
How to Test TTFB Yourself
According to DebugBear's guide to measuring TTFB, Chrome DevTools shows this value directly in the Network tab. Click the document request, open the Timing tab, and check the "Waiting for server response" value.
According to Redis' guide to testing TTFB, a simple command-line test using curl can also isolate this value directly, without needing a browser at all, useful for quick server-side diagnostics or automated monitoring scripts.
| Tool | Data Type | Best For |
|---|---|---|
| Chrome DevTools | Lab, real-time | Quick manual TTFB checks during development |
| WebPageTest | Lab, decomposed | Breaking TTFB into DNS, TLS, and server phases |
| PageSpeed Insights | Field + Lab | Combining real-user TTFB with diagnostic detail |
| curl command line | Lab, scriptable | Automated monitoring and server-side testing |
Fixing TTFB: The Highest-Impact Solutions
According to SEO Site Checkup's TTFB test guide, deploying a CDN reduces this delay two ways: edge nodes closer to users cut connection latency, and edge caching can serve responses without hitting the origin server at all.
According to Paid Hosting's complete TTFB guide, front-end optimizations like compressing images or deferring JavaScript reduce load time after the first byte arrives, but they cannot reduce TTFB itself, since that delay happens entirely before any of those resources are even requested.
Hosting Choices and Their Real-World Impact
Shared hosting environments split limited CPU and memory resources across many unrelated accounts on the same physical machine. A neighboring site experiencing a traffic spike can quietly slow down your own response times, even though nothing changed on your end.
Moving to a virtual private server, a dedicated instance, or a managed platform built specifically for your framework removes that unpredictability.
The improvement is not always about raw processing power. It is often about having consistent, dedicated resources rather than sharing an unpredictable pool with strangers.
For WordPress sites specifically, managed hosting platforms that include built-in object caching and optimized server configurations tend to outperform generic shared hosting by a wide margin, often without requiring any code changes on the site owner's part.
Database Optimization as a Long-Term Strategy
For dynamic, database-driven sites, query efficiency compounds over time as content volume grows. A query that performs acceptably with a thousand database rows can slow dramatically once that number reaches a hundred thousand, if the underlying table was never properly indexed.
Regular database maintenance, reviewing slow query logs, adding indexes to frequently filtered columns, and removing redundant plugin data on WordPress sites, prevents this kind of gradual degradation from creeping in unnoticed over months or years of continuous growth.
Combining this ongoing maintenance with the caching and hosting improvements covered earlier gives the most durable results, since caching masks a slow query rather than actually resolving the underlying inefficiency behind it.
Putting a Monitoring Routine in Place
A one-time fix rarely stays fixed indefinitely. New plugins, growing content volume, and infrastructure changes can all quietly erode the gains from an earlier optimization pass.
Setting up automated, recurring checks, even a simple scheduled script that logs response times weekly, catches regressions early, well before they compound into a noticeable slowdown that visitors and search engines both start to notice.
Documenting a baseline before making any changes, then comparing against that same baseline after each optimization, turns performance work into a measurable, repeatable process rather than a series of disconnected guesses about what might help.
FAQs on Time to First Byte (TTFB)
Related Articles
- What Is Largest Contentful Paint (LCP)? How to Diagnose and Fix It
- What Is First Contentful Paint (FCP)? How It Affects SEO and User Experience
- How to Measure Core Web Vitals: PageSpeed Insights, Lighthouse, CrUX & Search Console
- Lazy Loading Images Explained: Best Practices That Improve LCP Without Hurting SEO
What We Learn Today
TTFB measures the delay before a browser receives the first byte of a response.
A good TTFB is 0.8 seconds or less; poor is above 1.8 seconds.
TTFB breaks into DNS, connection/TLS, redirects, and server processing.
Front-end fixes cannot reduce TTFB; the delay happens before they load.
Server processing, hosting, and missing CDNs are the top causes.
Fixing TTFB improves LCP and FCP simultaneously, since both depend on it.
Related Posts

Previous Post
Next Post
Previous Post
Next Post



- Artificial Intelligence
- Content
- Core Web Vitals
- Development
- Digital Marketing
- Display Advertising
- Google Ads
- Google Search Console
- GTM
- HTML
- HTML CSS
- JavaScript
- Keyword Research
- Link Building
- LinkedIn Ads
- Local SEO
- Meta Ads
- Mobile SEO
- Off-Page SEO
- On-Page SEO
- Paid Media
- Paid Media Analytics
- PHP
- PPC Strategy
- Python
- SEO
- SEO Basics
- SEO Tools
- Social
- Technical SEO